Our services

Batch Testing and Release of Final Products

Qualimetrix is GMP approved to perform routine testing and release of final products (chemical and biological). This activity also involves batch release testing, for products manufactured outside of the EU which are planned for importation and release within the European market (EU testing).

We are testing thousands of batches per year of all pharmaceutical forms including oncological products:

  • Tablets
  • Capsules
  • Injectables
  • Locally applied products
  • Inhalers

Services in details:

- Analytical method transfer

- Testing according to the product specifications and issuance of CoA

- QP declaration

- Batch Certification (Batch Quality Release)

- PQR

- Storage of reference/retain samples

- On going stabilities

APIs testing

QualiMetrix provides comprehensive quality control testing services for APIs according to the Pharmacopoeia (e.g. EP, USP, BP and JP) or to the in-house specifications.

The chemical, physical and physico-chemical tests include:

  • Assay
  • Impurities
  • Genotoxic impurities
  • Water (Karl Fischer, Coulometer)
  • Identification tests (IR, TLC, HPLC)
  • Acidity or alkalinity
  • Appearance of solution
  • Solubility
  • Sulfated ash 
  • Chlorides
  • Flurides
  • Sulphates
  • Elemental impurities (AAS, ICP/MS)
  • Heavy metals
  • Melting point
  • Freezing point
  • Boiling point
  • Hydroxyl value
  • Specific optical rotation
  • Viscosity
  • Loss of ignition
  • Loss on drying
  • Average relative molecular mass
  • Ethylene oxide, Propylene oxide and Dioxan content
  • Degree of polymerization
  • Non-volatile residue
  • Ether soluble substances
  • Water soluble substances
  • Acid value
  • Saponification value
  • Relative density
  • Refractive index
  • Microbiological contamination
Stability Studies

Comprehensive stability testing services that are conducted according to ICH guidelines, preapproved Stability Study Protocols and under strict quality procedures and GMP requirements.

All climatic zones: I, II, III, IVa and IVb.

Long term, intermediate and accelerated storage:

  • 25 °C / 60% R.H.
  • 25 °C / 40% R.H.
  • 30 °C / 35% R.H.
  • 30 °C / 65% R.H.
  • 30 °C / 75% R.H.
  • 40 °C / 75% R.H.
  • 5 °C
  • -20 °C
  • -80 °C

Sponsor’s specific storage requirements can be discussed on a case by case basis.

All chambers are fully and continuously monitored and controlled as they are connected to a 24/7 online alarm system

Besides storage and analysis, our services also include guidance and advice on:

The design of the study: Full Design or Bracketing and Matrixing Reduced Design (ICH Q1D guideline)

The statistical evaluation of the stability data: extrapolation of data and declaration of the storage conditions (ICH Q1E guideline)

chambers

Post approval (ongoing) stability studies

The stability of a final product should be monitored according to a continuous and appropriate program that will permit the detection of any stability issue (e.g. changes in levels of degradation products). The purpose of the ongoing stability program is to monitor the final product and to determine that the final product remains, and can be expected to remain, within specifications under the storage conditions indicated on the label.

Photostability studies with temperature and humidity control (according to ICH Q1B)

According to ICH Topic Q1B (CPMP/ICH/279/95) Note for Guidance on the Photostability testing of new Drug Substances and Products, the photostability testing is typically performed in a climate chamber where the temperature is maintained at 25 °C and the relative humidity at 60%.

The climate chamber is equipped with an appropriate light source which after a specific time exposure provides overall illumination of not less than 1.2 million lux hours and an integrated ultraviolet energy of not less than 200 watt hours/square meter.

The light source is the combination of two tubes which leads to a spectral distribution according to option 2 of the Guideline CPMP/ICH/279/95 (Q1B):

Fluorescence tubes cool white: T8 fluorescence tube in the form of a rod with a tube diameter of 26 mm. Emissive range in the spectral range of 400 to 800 nm. The relative spectral distribution meets the F6 standard (cool white) acc. to ISO 10977.

Fluorescent tube: T8 fluorescence tube in the form of a rod with a tube diameter of 26 mm. Emissive range in the visible spectral range of 400 to 800 nm and in the UVA range of 320 to 400 nm.

The samples are exposed side-by-side with a validated chemical actinometric system to ensure the specific light exposure is obtained. A solution of 2% w/v quinine monohydrochloride dihydrate is prepared and two aliquots, one wrapped in an aluminum foil and one uncovered, are exposed side-by-side with the drug products for the same duration.

In accordance with the ICH Guideline Q1B, the light exposure and further testing are usually performed on: a) the unpacked drug product, b) the drug product in the primary packaging, c) the drug product in the full marketed packaging system (including secondary packaging), d) the drug product covered by aluminum foil for application of dark conditions.

Validation of analytical methods

The objective of validation of an analytical procedure is to demonstrate that the analytical procedure is suitable for the intended purpose.

A validation study is designed to provide sufficient evidence that the analytical procedure meets its objectives. These objectives are described with a suitable set of performance characteristics and related performance criteria, which can vary depending on the intended use of the analytical procedure and the specific technology selected.

Methods are validated in accordance to the current regulation (e.g. ICH guidelines, Pharmacopoeia monographs), and sponsor’s specific protocol. The critical parameters that may affect the method performance are taken into consideration, and the study involves among others the following:

  • Specificity and selectivity
  • Linearity and range
  • Repeatability and intermediate precision
  • Accuracy
  • Robustness
  • Standard and sample solution’s stability
Genotoxic impurities

Genotoxic impurity (GI) analysis is critical to address the purity, safety and quality of drug substances or finished drug products. The ICH M7(R1) defines genotoxicity as “A broad term that refers to any deleterious change in the genetic material regardless of the mechanism by which the change is induced”.

The genotoxic impurity testing is performed in APIs and final products in order to detect and evaluate the potential formation of GIs and thus support the product from the early stages of the development to market release.

The specific and sensitive analysis is performed using the below techniques:

- LC-MS, LC-MS/MS

- GC-MS, GC-MS/MS

- ICP-MS

Elemental impurities (according to ICH Q3D Guideline)

Elemental impurities in drug products may arise from several sources (e.g. residual catalysts employed during the synthetic process of the drug substance, interaction of the final product with manufacturing equipment or the container closure system, etc.). Since elemental impurities do not provide any therapeutic benefit to the patient, their levels in the drug product should be controlled within acceptable limits. To this end, ICH Q3D presents a process to assess and control elemental impurities in the drug product using the principles of risk management.

The risk assessment process can be described in three steps:

  • Identify known and potential sources of elemental impurities that may find their way into the drug product.
  • Evaluate the presence of a particular elemental impurity in the drug product by determining the observed or predicted level of the impurity and comparing with the established PDE.
  • Summarize and document the risk assessment. Identify if controls built into the process are sufficient or identify additional controls to be considered to limit elemental impurities in the drug product.

The first step of the risk assessment process comprises of the identification of known and potential sources of elemental impurities that may find their way into the final product. The figure below illustrates potential sources that will be considered during the evaluation.

risk

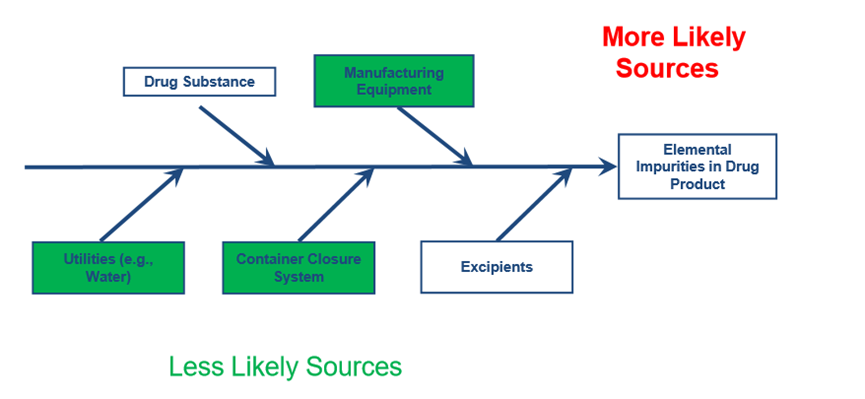
A Failure mode and effect analysis (FMEA) is conducted in order to identify and assess the risk associated with each potential source of elemental impurities. FMEA is a highly structured, systematic technique for failure analysis. It involves the review of all components depicted in the Figure above in order to identify failure modes and their effects. For each component, their failure modes and their resulting effects are recorded in a FMEA sheet. Each failure mode is associated with a material, process or parameter that could serve as a source of elemental impurities. The failure effects correspond to the metals that could emanate from each source. The degree of severity of the effects, their respective probabilities of occurrence, and their detectability are assessed by assigning appropriate numerical values. A Risk ranking and filtering approach is subsequently adopted in order to compare and rank risks. The hybrid FMEA and Risk ranking and filtering methodology aims at facilitating the investigation and the subsequent establishment of additional measures / controls  in case the elemental impurity levels exceed the control threshold ( 30% of the PDE). The identification process is based on the review of the API, excipient and drug product manufacturing process to identify known and potential sources of Elemental Impurities. The elements that have to be considered are Class 1 and 2A metals, 2B in case they have been intentionally added, and class 3, depending on the route of administration. In all cases, all intentionally added elements have to be assessed.

The next step is the evaluation of the presence of particular elemental impurities in the drug product. The latter is based on the collection of predicted and/or observed levels of elemental impurities and the subsequent comparison of data with the established Permitted Daily Exposure. The data to support the evaluation may emanate from published literature, data generated from similar processes, supplier information data (e.g Certificates of Analysis), testing of the components of the drug product or the final product itself.

The final step comprises of the documentation and summary of the risk assessment and the identification of additional control requirements if needed.

The proper implementation of the guideline requires a combination of a scientifically sound risk-assessment and testing of the final product and/or components. Based on the amount and quality of available data one could minimize the required testing. However, the level and variability of an elemental impurity should be well established. The latter means that in the absence of other justification, data from testing 3 representative production scale lots or 6 representative pilot scale lots of the component(s) or drug product would be required.

icp

Comparative Dissolution Profiles

In the frame of the guideline for the investigation on Bioequivalence of pharmaceutical products in vitro dissolution tests are performed at three different buffers (normally pH 1.2, 4.5 and 6.8) and the media intended for drug product release (QC media), obtained with the batches of test and reference products. 

In dissolution profile comparisons, especially to assure similarity in product performance, regulatory interest is in knowing how similar the two curves are, and to have a measure which is more sensitive to large differences at any particular time point. For this reason, the f2 comparison has been the focus in Agency guidances.

FDA has set a public standard of f2 value between 50-100 to indicate similarity between two dissolution profiles.

A f2 value of 50 or greater (50-100) ensures sameness or equivalence of the two curves and, thus, the performance of the two products.

A general question is how large can the difference between the mean dissolution profiles be before the difference is likely to impact on in vivo performance. From a public health point of view, and as a regulatory consideration, a conservative approach is appropriate. The f2 comparison metric with a value of 50 or greater is a conservative, but a reliable estimate to assure product sameness and product performance.

ESPA Banner